Google Trends is a incredibly
easy to use tool to use, and it allows users to quickly "trend data"
on a variety of topics. These data are based on the volume of searches
conducted on Google, and serve as a good indicator for buzz or interest in a
topic, product or service. To access and begin playing with Google search
data go to:
https://www.google.com/trends/
Let's do a basic analysis in a few steps.
1) At the top of the page you will see
an area to "Explore Topics." Since movies are usually a good topic
for trending -- they need to create buzz quickly since they don't stick around
very long in theaters, let's look at a current movie and some upcoming movies
to see how much buzz they are creating (don't worry, we'll explain the data
once we have something to look at). We're going to use Hidden Figures (#1
at Box Office yesterday) as our Topic.
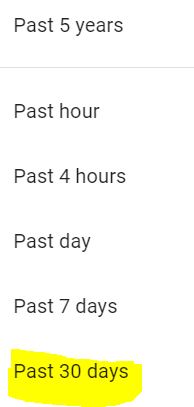
Google
defaults to a 5-year trend so we will change that to look at only data for the
past 30 days:
Also,
see the dropdown menu which indicates Worldwide, I'm going to change that to
United States to keep my data more focused (no image since I hope you're
getting the hang of this by now). Here's the topline results (again,
we'll discuss interpretation and more detailed analysis later).

2)
Now that we've got some data to look at let's make our analysis richer by
adding some competitors. Note the box on the upper right part of the
page labeled "+ Compare." Let's use that to make some
comparisons to other films: La La Land and Fences (both of which had earlier
release dates). Below you'll see those results for those three films:
Hidden Figures (Blue), La La Land (Red) and Fences (Yellow).

Now
that we've got some substantial data to work with, let's take a moment to
understand what the data really mean with some interpretation. The data
are indexed to 100, meaning that 100 represents the peak volume of interest
(searches) for the entire data set. On January 9 La La Land produced a
100 index value, which was the day following its seven-win victory at the
Golden Globes. Fences peaked with an index value of 78 on December 26,
which is the day following its release in over 2,000 theaters nationwide. Hidden Figures peaked on January 7 with a value of 86, again consistent
with its release to over 2,000 theaters (from the 25 it was playing in
earlier).
Let's
take a moment to interpret those values again. La La Land had a 100 index
value on January 9 and a 43 on January 8, indicating that its search volume more
than doubled (43 to 100) with its Golden Globe wins. We can do the same analysis with
any of the data for the films or the data between the films. So, if La La Land
had a 100 on January 9 and Hidden Figures produced a value of 86 two days
earlier we can see that La La Land's peak was 14% higher than that for Hidden
Figures (100 vs. 86).
Here's
how Google explains the index values:
Numbers represent search interest relative to the highest
point on the chart for the given region and time. A value of 100 is the peak
popularity for the term.
Cool?
3) Data analysis always benefits from looking at the
dimensions of the data, and Google Trends provides some great features that
make this easy. Let's focus on Hidden Figures, and scroll down the screen
from the trends chart we've just created. Here we'll find a map that
looks like this:

If we scroll over the map it will identify the index value
for each state, and we can see that Maryland produced the most interest with a
value of 100 (remember it's an index, so that's the peak value), followed by
the District of Columbia (98) and Virginia (87). If you click on the
Subregion menu and then the List View icon that is directly next to it on the
right, you'll get a list of the states and their index values.

You can play around with this and drill down to Metro areas,
but at this point you should understand that Google Trends allows for
drill-downs by region. If we had done our analysis on a Worldwide basis
we could have compared Google search volume for different countries for each of
our topics.
4) Finally, let's briefly look at Related Queries.
These are other search terms that were searched by the same persons who
searched our Topic: Hidden Figures. This is helpful information
because it can help us design a search engine strategy or fathom what it is
potential customers are looking for when they search our Topic. In this
case it's mostly related search terms like Hidden Figures movie, but we also
see that a competitive film, Fences, was also searched by many of the same
persons who were searching Hidden Figures. Also, searches for "hidden
fences," which is a mash-up of two movie titles appeared to generate some
search volume (following some confusion at the Golden Globes where presenters
muffed the title).

There you have it. There's more you can do with Google
Trends by playing and experimenting, but this walk through should be enough to
get you started.
No comments:
Post a Comment